SQL: generate a report with dynamic columns by month
Hi all! This time I’ll try to dig a little bit into the fabulous realm of SQL and see how we can generate a nice report with dynamic columns.
The need: I had to generate a report showing some counts divided by month, basically the columns represent the months and the user has the possibility to pick a date range.
For example, imagine that you want to select the number of orders placed by all the customers by month.
Using the standard Northwind database as a reference, the first thing to do is to generate a list of months along with the relative start and end days:
The next step is “quite” easy: all we have to do is to generate a string containing the main query that picks all the customers and has many sub-queries, one for each month, SELECT-ing the count of the orders.
As you may see, most of the work is done with lines 5-10 where we use the COALESCE function to concatenate the sub-queries created using the #dates temp table. Note that each query will contain a WHERE clause that filters the Order by Customer.
On lines 12-13 we create the final query to be executed, and finally, on line 16 we ask sp_executesql to run our code.
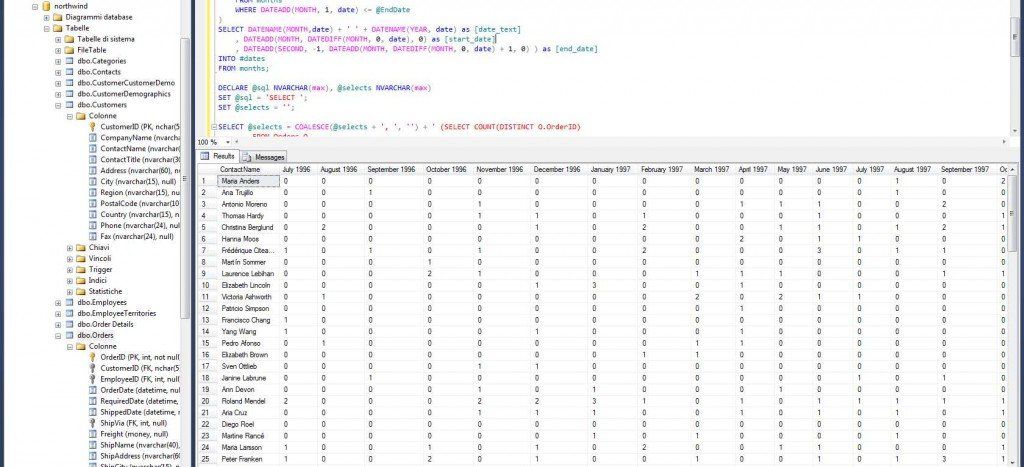
Here’s a screenshot of the results:

Don’t forget to DROP the #dates table! 😀
Did you like this post? Then


